
In many reviews of graphics cards, laptops, or system units, you will find game benchmarks that show performance based on FPS (frames per second). However, you may want to check your FPS in your favorite game. If you don’t know how to do it, today we’ll try to understand the nature of these «magic» values and look at some popular applications for measuring them.
Content
- 1 What is Framerate?
- 2 What are 0.1% Low and 1% Low?
- 3 Smoothness Coefficient
- 4 What is Frametime?
- 5 Steam: One setting and you’re done!
- 6 Microsoft/Xbox Game Bar: Why?
- 7 FRAPS and FRAFS: The grandparents of monitoring
- 8 What about Apple? Monitoring in the Metal API
- 9 Intel PresentMon: Simple and strange at the same time
- 10 MSI Afterburner + RivaTuner: the good old classic
- 11 CapFrameX: A new word for professional computer reviewers
What is Framerate?
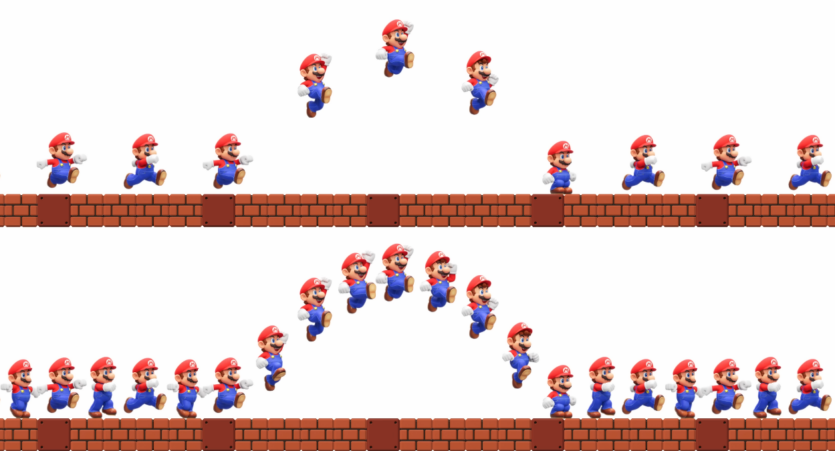
Any video you watch on your phone, TV, computer, or other electronic device is made up of Frames. To give a simple example, any screenshot you take is a frame. Even the User Interface (UI) created by any operating system generates frames for you. That’s why it’s important to have not only a high display refresh rate (120+ Hz) in your monitor or smartphone, but also to have an image «created» from OS or game frames that matches this value.
The new Nintendo Switch 2 will support 120 FPS.
The Frames per second (FPS) indicator shows how many frames are generated by the system. The more scientific name is Framerate. As you can understand, the higher this value is, the smoother the image on the display. And this leads to a rough conclusion — the smoother, the more productive your system is. But one thing is the UI in the OS, and the other is games. By the way, the FPS value is calculated immediately after all the necessary values are received, not in real time.
In all kinds of tests, you can see various tables and graphs that show not just the simple FPS, but its Average (Avg). How to measure it? You need to record the game for a certain period of time (30, 60 seconds or more). Sum the obtained values and divide them by the time of the test recording. The better known name for this operation in mathematics is the arithmetic mean. In modern software, this calculation is automated, so you do not need to do it yourself.
For many reviewers and users, the average FPS will be enough. But we will go further.
What are 0.1% Low and 1% Low?
However, the Average value does not always «works with» as everyone usually thinks. If there were freezes or lags during the recording of the game moment, the Average FPS value will indeed drop, but the overall result will seem good. Therefore, the tests also calculate the value of Rare and Very Rare events. Usually, they are displayed in the graphs as 1% Low and 0.1% Low. Gamer Nexus was one of the first to add these two values to reviews.
Here’s a simple example: there are two computers with the same scene in the same game. Below are the test results. For clarity, we’ll add frame graphs:
- PC #1: 97, 98, 96, 100, 30, 35, 34, 97, 98, 96, 98, 97, 98, 100, 99, 95, 96, 98, 97, 95, 99, 98, 100, 97, 98, 95, 93, 94, 30, 30, 30, 100, 98, 96, 99 Average FPS: 86.
- PC #2: 80, 79, 78, 78, 70, 72, 72, 80, 80, 80, 79, 79, 80, 76, 76, 76, 77, 77, 77, 76, 77, 78, 80, 80, 79, 77, 79, 79, 70, 74, 70, 76, 79, 77, 80 Average FPS: 77.
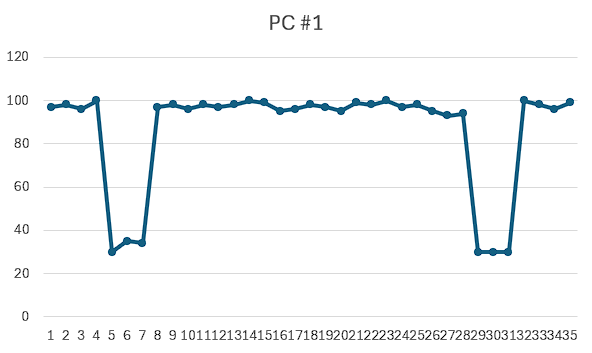
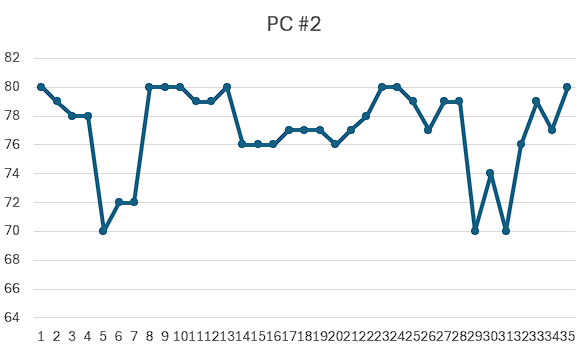
In terms of average FPS, the first PC is clearly superior to the second PC. But the gameplay itself is better on the second PC. Why? Sharp «dips» up to 30 FPS in the first case will be strongly felt when the game is smooth. A classic example of such a drop is loading shaders or other complex visual effects in Unreal Engine 3, 4, and 5.
An interesting example: a long time ago in World of Tanks, one of the maps had a sharp drop in FPS when the player looked at one of the buildings. As it turned out, one of the 3D designers accidentally left a high-poly duckling inside this house. We removed the duckling and everything became normal.
So how will 1% Low and 0.1% Low help if you can look at the minimum FPS value? Unfortunately, the minimum value can occur completely accidentally or when loading a new graphic object and effect. It is clear that these values will be different on different «hardware». We are interested in comparing different components in the same scene/benchmark and the impact of the same «problems» on them. We need to go back to math again. Or rather, to such scary statistics.
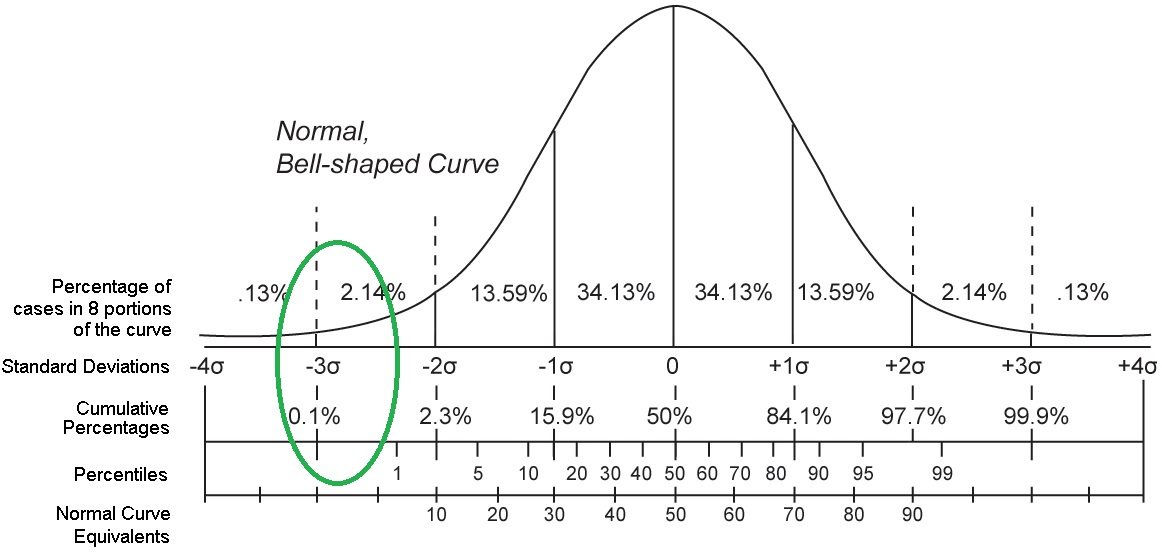 Schedule Normal distribution.
According to the Normal distribution, if we wait long enough to get the results, we can get a graph similar to the one above, in which
- The number of points will increase towards the middle;
- The maximum number of points will be in the middle;
- The dots will decrease after the middle;
- There are not many points at either end of the graph;
The normal distribution is suitable for showing and understanding the process of further calculation: many average FPS values; under high loads we get low FPS (for example, loading shaders), and under light loads — high FPS (looking at a static sky or at a wall). Therefore, let’s start calculating 1% Low and 0.1% Low (shown in green on the graph), since they will show the minimum sampling with a long-term performance drop.
0.1% Low and 1% Low — the arithmetic mean of the lowest values of the total FPS sample.
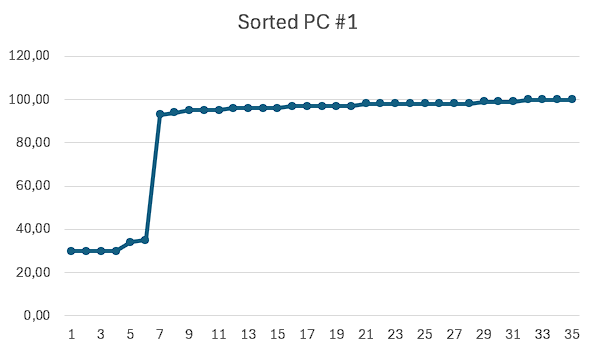
For example, from a sample of 10,000 results, the range for 0.1% Low is 10 values, and for 1% Low — 100. After determining this number, the arithmetic mean of these 10 and 100 values is calculated, and we get 0.1% Low and 1% Low, respectively. Taking the example with a small sample (35 in total) from PC #1 and PC #2 above, let’s make a table of results by sorting the previous results:
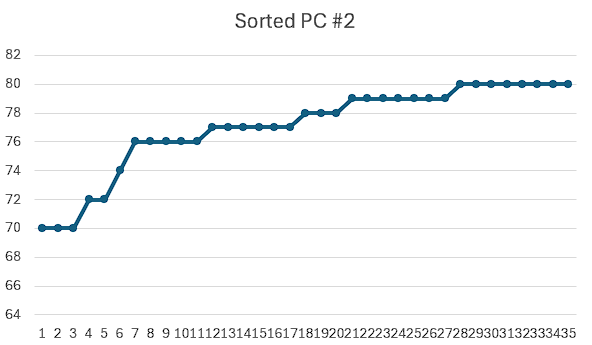
| PC #1 | PC #2 |
| Average FPS: 86 | Average FPS: 77 |
| 0,1% Low: 30 | 0,1% Low: 70 |
| 1% Low: 30 | 1% Low: 70 |
Smoothness Coefficient
This phrase can explain attempts to complicate and deepen the calculations. Returning to the Normal distribution and statistics, some people consider it necessary to use the Variation Coefficient as a basis for the «Smoothness Coefficient» in games. The Coefficient of Variation (CV) — is a statistical indicator that tracks the deviation of graph points from the mean.
To determine CV, you need to calculate the mean value μ, the standard deviation σ, and use the formula: CV = (σ/μ)*100%.
| PC #1 | PC #2 |
| The average value of μ: 86,03 | The average value of μ: 77,06 |
| Standard deviation σ: 22,41 | Standard deviation σ: 2,99 |
| CV: 26,05 % | CV: 3,88% |
Now let’s calculate the Smoothness Factor (SF) using the following formula: KP = 100% – CV. As a result, we obtain mathematical confirmation that PC #1 in the fictional scene has a weak smoothness (CP = 73.95%), and PC #2 — a very high value (CP = 96.12%).
What is Frametime?
All this time we’ve been talking about personnel. But there is an equally important characteristic, namely the time it takes to create these frames. Frametime — is a parameter that shows how many milliseconds (ms) it takes to build one frame. Framerate and Frametime are inextricably linked. For example, for a game at 60 FPS, the time of one frame should be 16.67 ms, and at 120 FPS — 8.33 ms. This characteristic is determined by the formula: Frametime = 1000 / FPS, where 1000 is the number of milliseconds (1 sec = 1,000 ms) and FPS is the value of frames/sec in this time period.
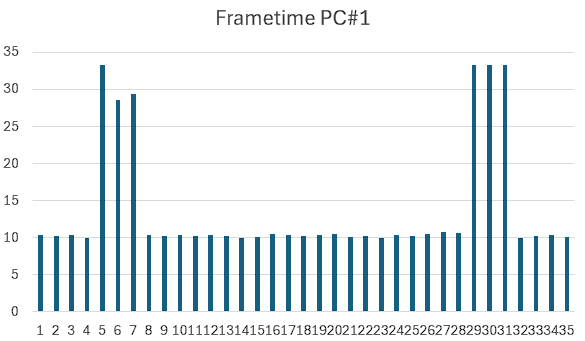
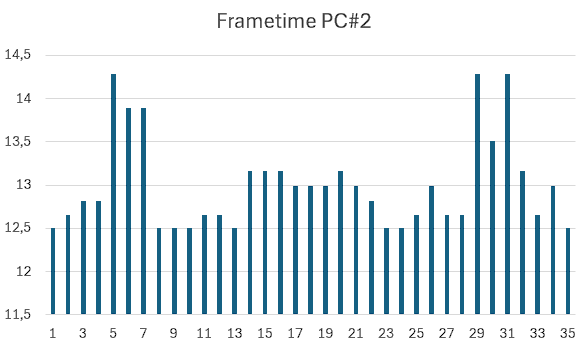
Frametime schedule for PC #1 and PC #2
The Frame Time parameter is also important, although not for performance, but for better system stability. The smaller this value is, the smoother the game is (FPS increases) and the less microfreezes or staters (delays) appear. For example, the Frametime of the first frame is 0.8 seconds, and the next 59 frames are generated for the next 0.2 seconds. The average FPS will be 60 FPS. But you get a stutter of almost a second (0.8), which greatly affects the smoothness of the game.
Steam: One setting and you’re done!
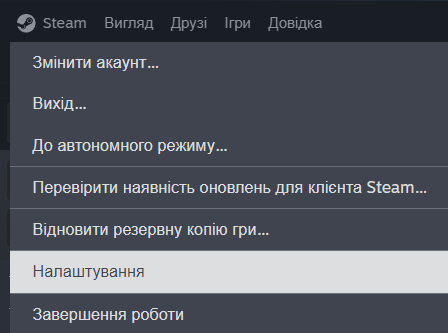
Application Steam by Valve is the standard for PC gaming. If you play games on a Windows-based computer, laptop, or portable console (especially on SteamOS), you should already have it installed. You click Steam key — Settings — In Game — In-game FPS counter.
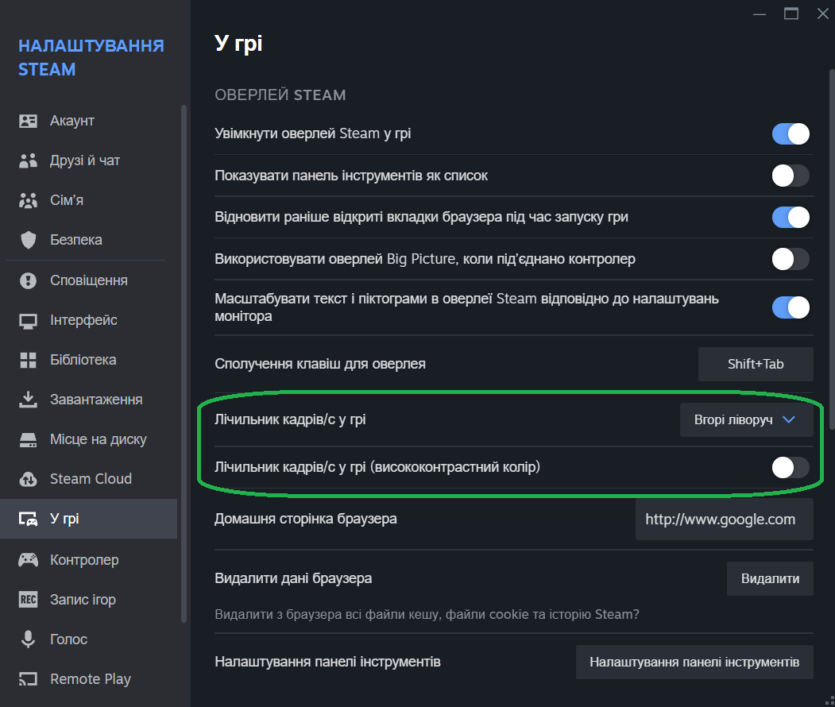
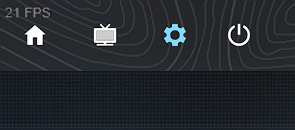
All you have to do is choose where the counter will be located and go ahead and watch the FPS. Now you can see a small FPS counter in any game on Steam. For most people, this will be enough. But what if the game is not on Steam but in the Microsoft Store? The Game Pass subscription is quite interesting.
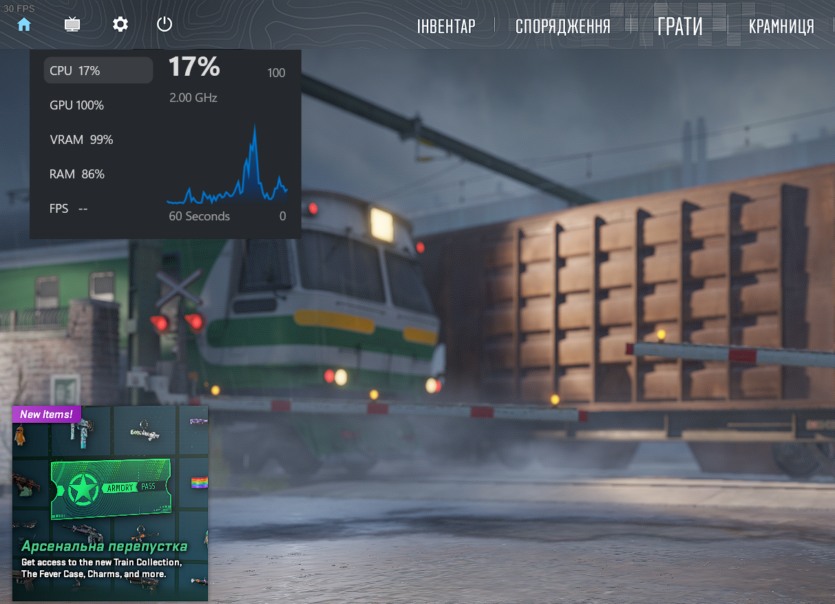
Microsoft/Xbox Game Bar: Why?
Few people know, but Microsoft has built into its Windows 11 operating system the Game Bar application — an additional menu on top of the game. It contains several additional actions (for example, video recording), but we are interested in the FPS counter. It is launched using the key combination Win+G. If this does not work, you can find the Game Bar application in the search bar next to the «Start» key. Then press the Performance Mode key (the image resembles a heartbeat).
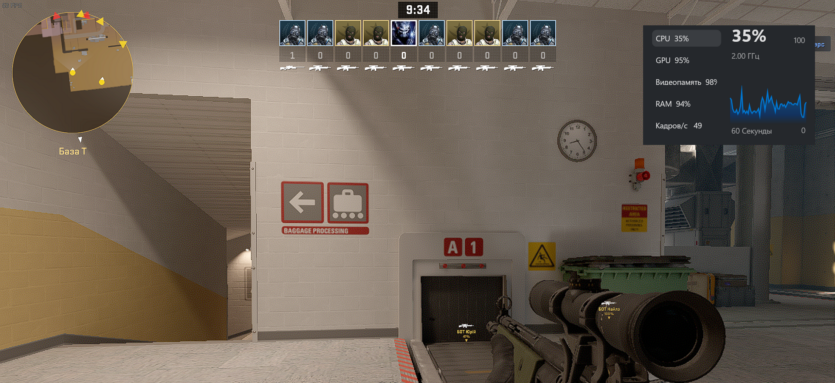
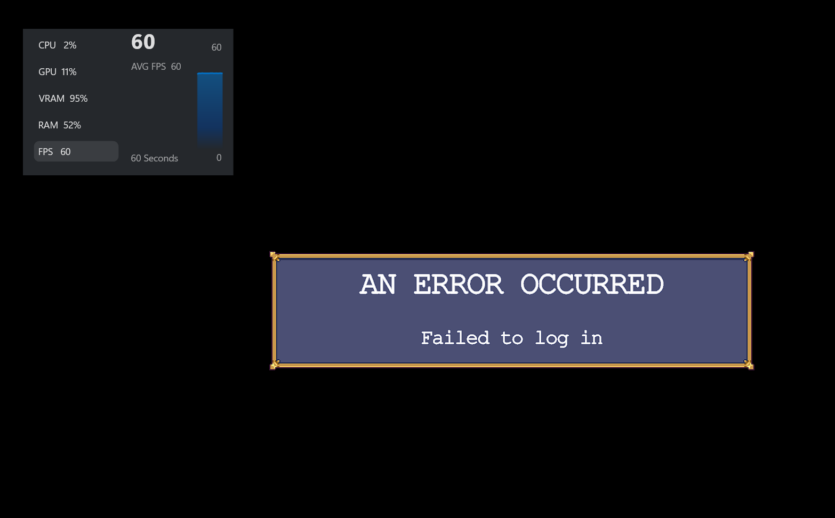
Not all games will show the FPS counter (Counter Strike 2). It’s constantly glitchy.
A rather large menu with a graph appears. The Game Bar shows not only the current and average (AVG) FPS, but also the Central Processing Unit (CPU), Graphics Processing Unit (GPU), allocated Graphics Memory (VRAM), and RAM percentage. If you don’t need any of these items or want to change the location of the frame rate graph, click Settings next to the Pinning button on this menu.
Unfortunately, Game Bar is quite problematic by nature. Therefore, its use is strictly not recommended!
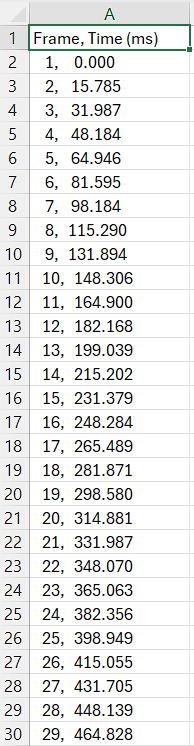
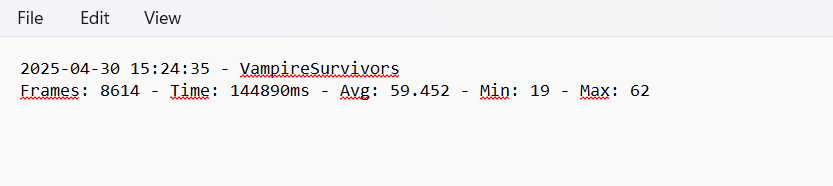
FRAPS and FRAFS: The grandparents of monitoring
One of the most famous and recognizable logos in computer history belongs to FRAPS, one of the oldest programs for monitoring FPS and recording gameplay. The last update is dated February 26, 2013, but don’t discount FRAPS.
Even on Windows 11 in 2025, FRAPS is stable!
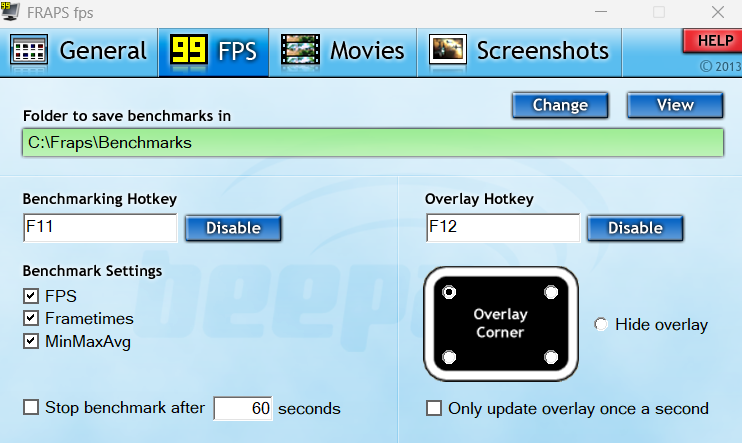
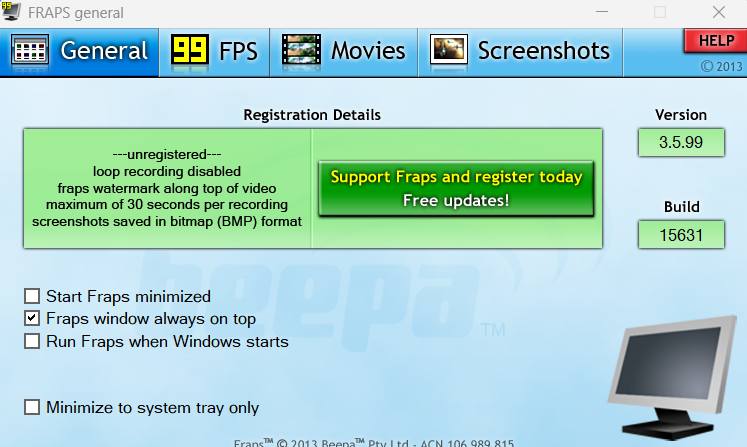
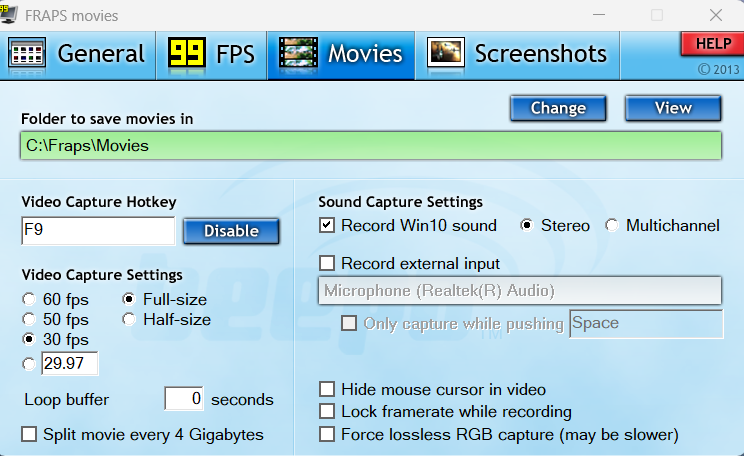
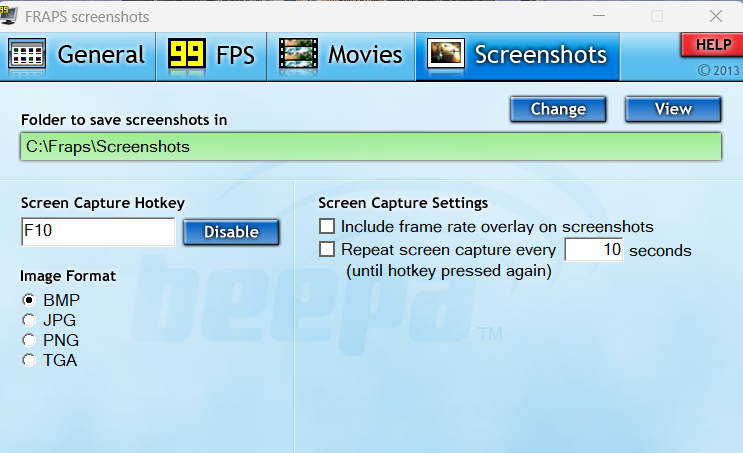
The impact of FRAPS on history is so great that many people will be able to tell their own story of introduction and use. It was this program that introduced certain standards for displaying the FPS counter, namely, along the edges of the screen, recording benchmark results, and had a feature that was ahead of its time — recording gameplay. Yes, the system was quite loaded, but it was worth it to share your gameplay.
Then there were «young and green».
FRAPS runs a benchmark and saves your frametime. What’s the best way to view them? Building graphs in Excel is generally convenient, but not in these cases. The FRAFS application comes to the rescue. It allows you to conveniently view the test results and defines 1% Low and 0.1% Low.
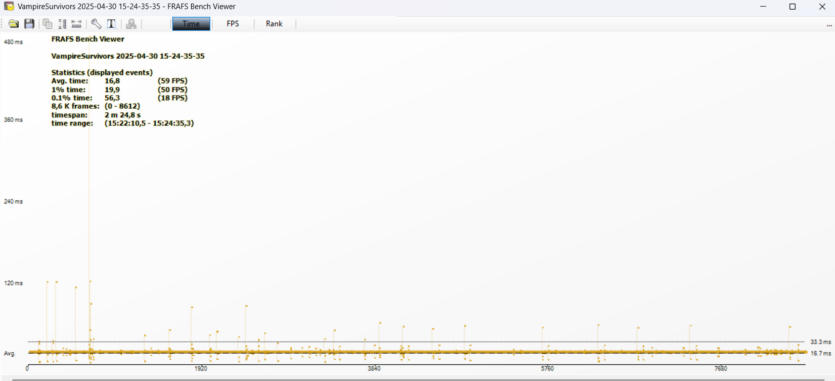
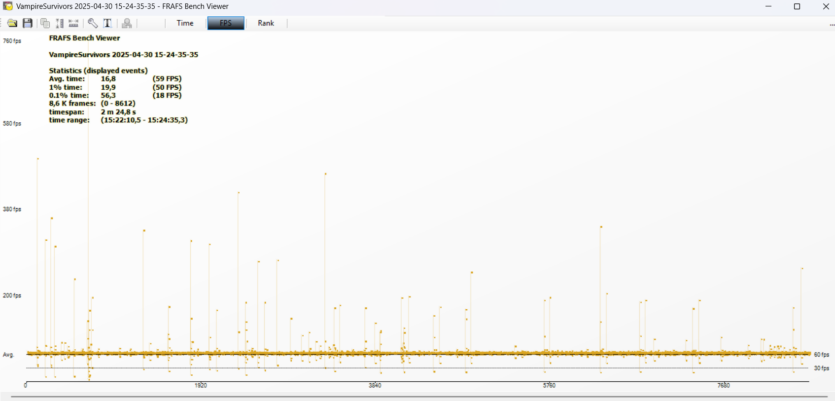
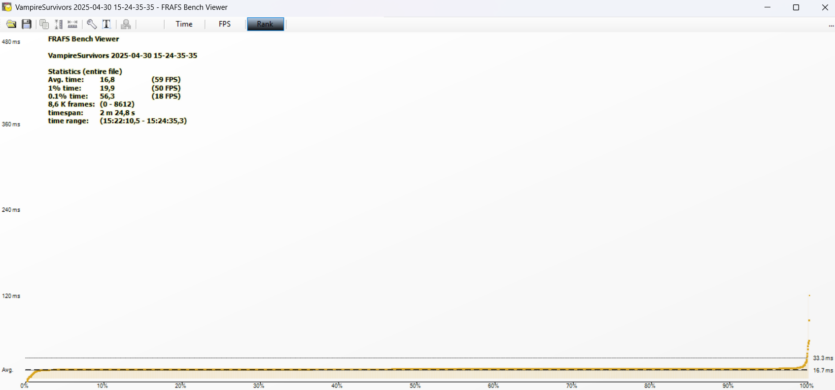
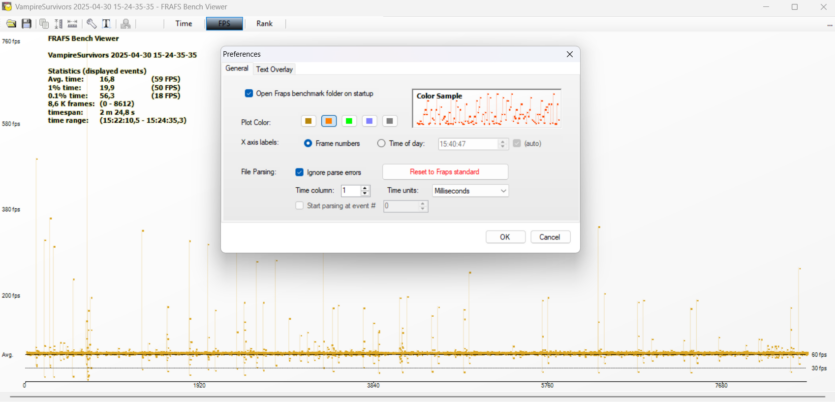
The interface of both apps is simple, so it’s not hard to understand how to use them. However, both of them are already outdated. There are now more convenient and functional monitoring tools. But we couldn’t help but mention the legendary app.
What about Apple? Monitoring in the Metal API
No matter what the opponents of mobile gaming say, they raise a lot of money there. Of course, Apple needs to develop this niche. It’s a slow process, but they are moving at least somewhere. The same Death Stranding for $15 can be purchased simultaneously on three platforms: iPhone, iPad, and Mac. Therefore, you need to have your own FPS counter to check the performance. For its Metal API, Apple has come up with a very simple way to check the performance built into the OS. Turn on the Terminal, paste the command /bin/launchctl setenv MTL_HUD_ENABLED 1. To turn off the HUD, replace the value 1 with 0 (you need to restart the game).
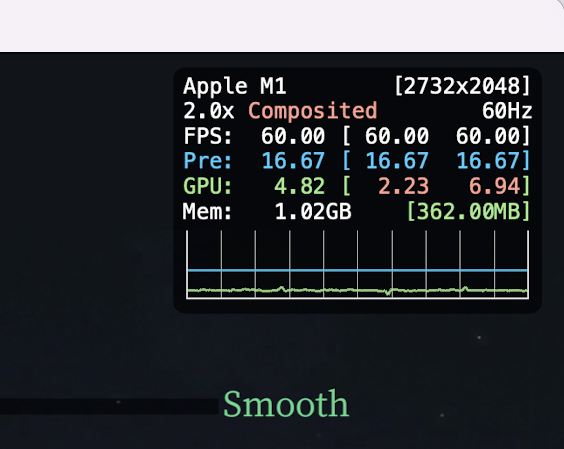
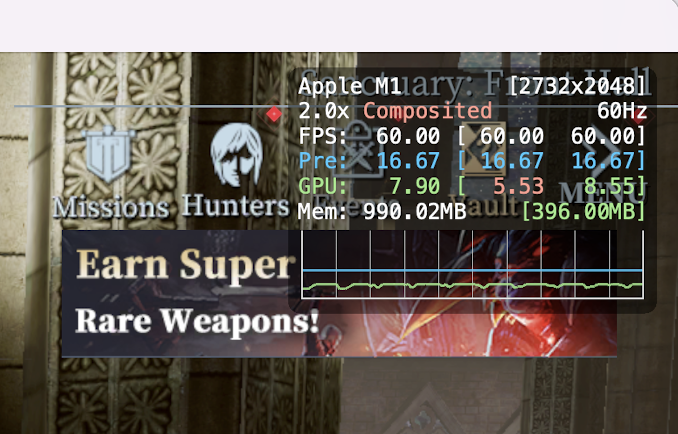
As you can see from the screenshots, the HUD may seem a bit confusing. Apple explained in the special article. You can find out what all these indicators mean: device name, resolution, display frequency, Framerate, Frametime, GPU utilization. Opposite the last three indicators, additional columns show the minimum and maximum values for the last 1.5 seconds. In general, nothing complicated.
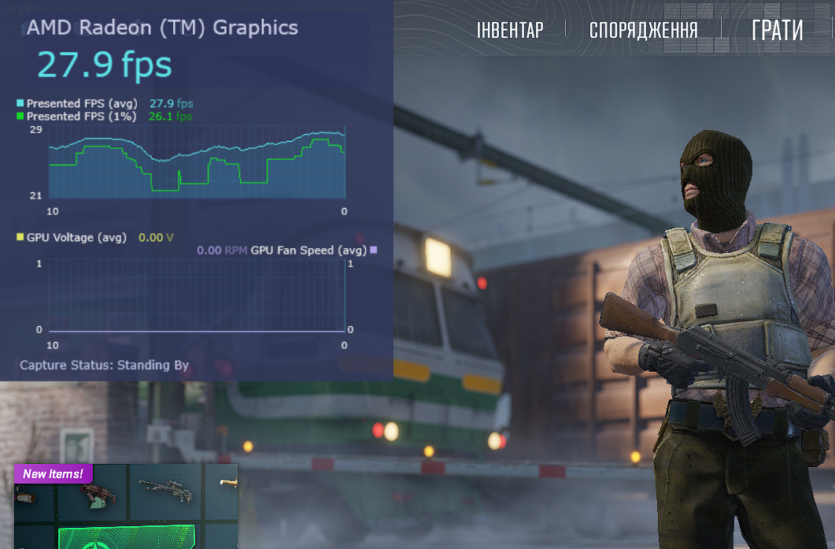
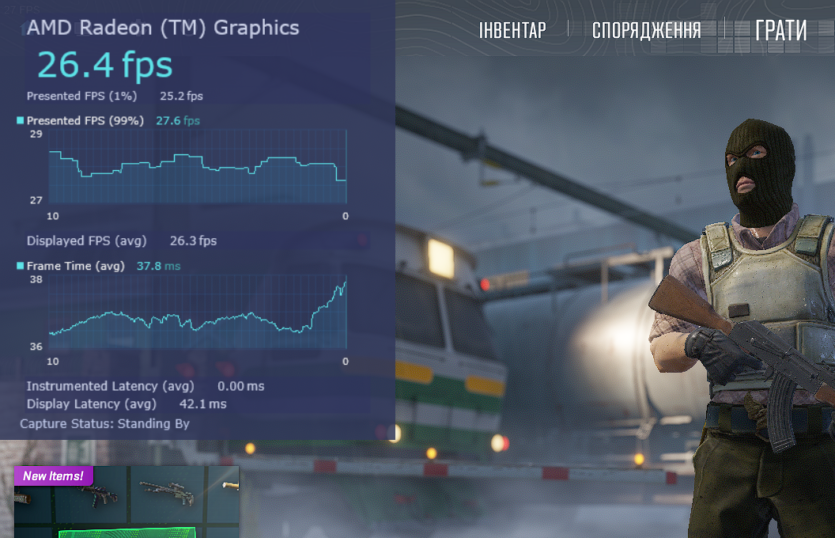
Intel PresentMon: Simple and strange at the same time
According to Github, Intel has been working with 2017 began to prepare its own analog for the then (and still) popular MSI Afterburner. If it wasn’t for the presentation of Intel’s Arc graphics cards, many people would not have known about this application. Downloaded from Intel’s official website.
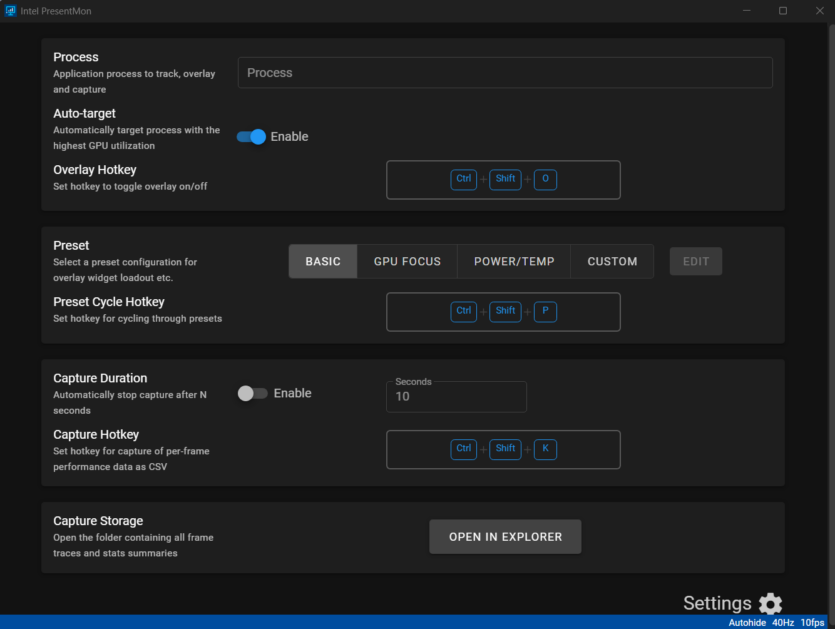
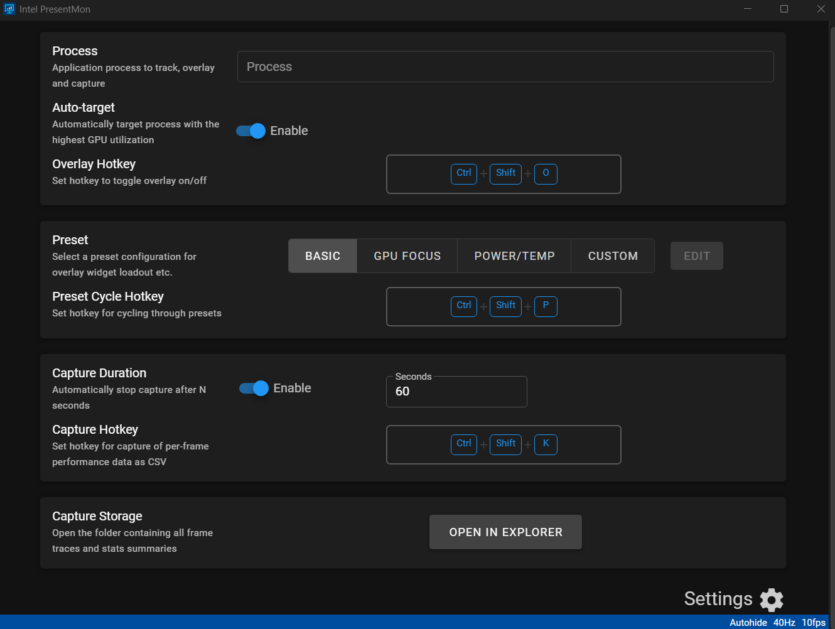
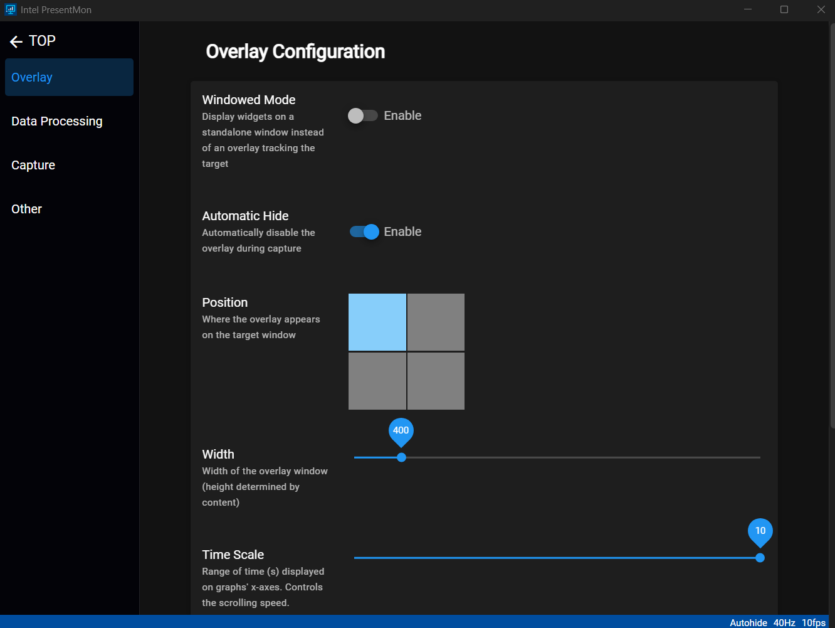
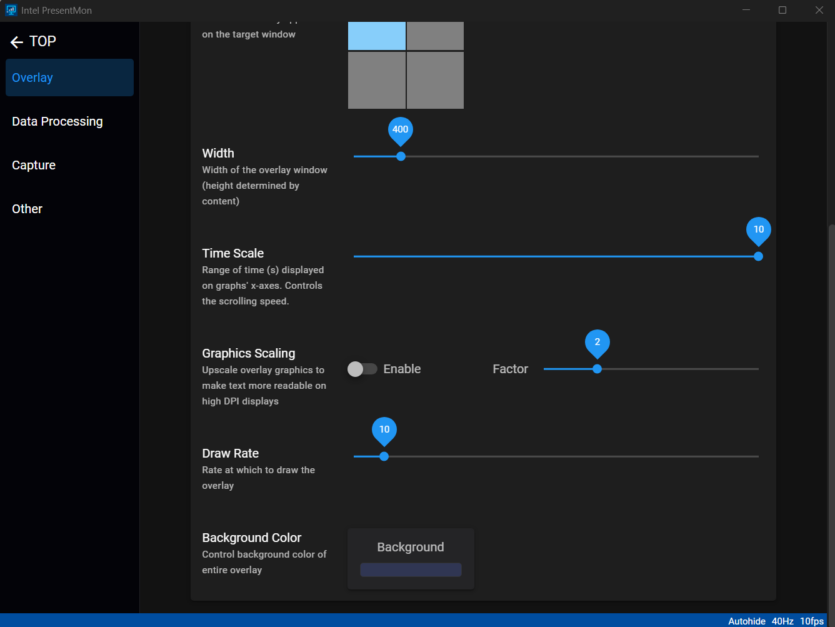
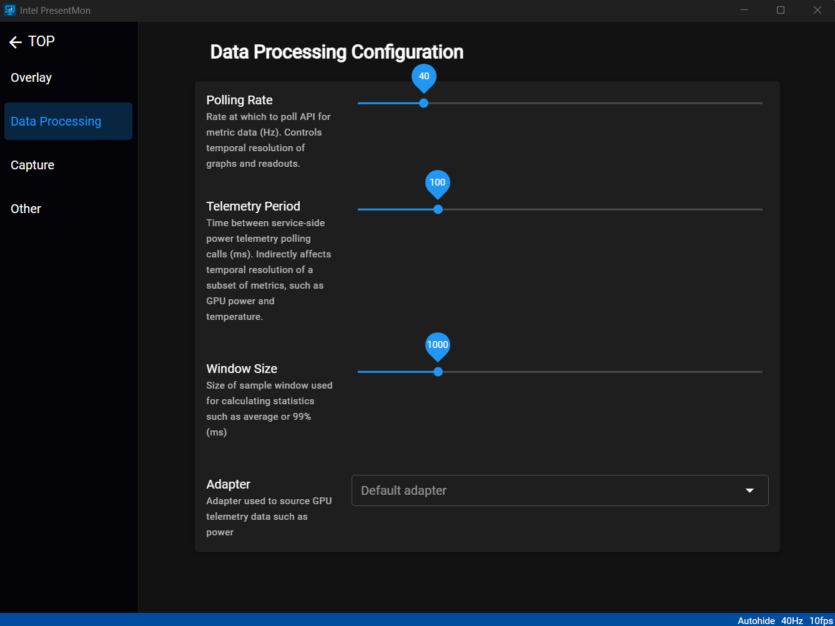
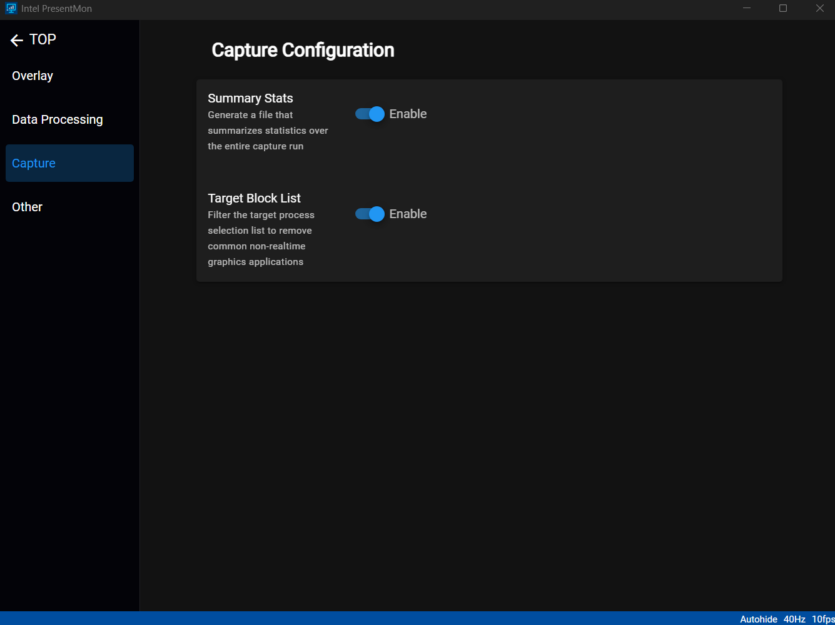
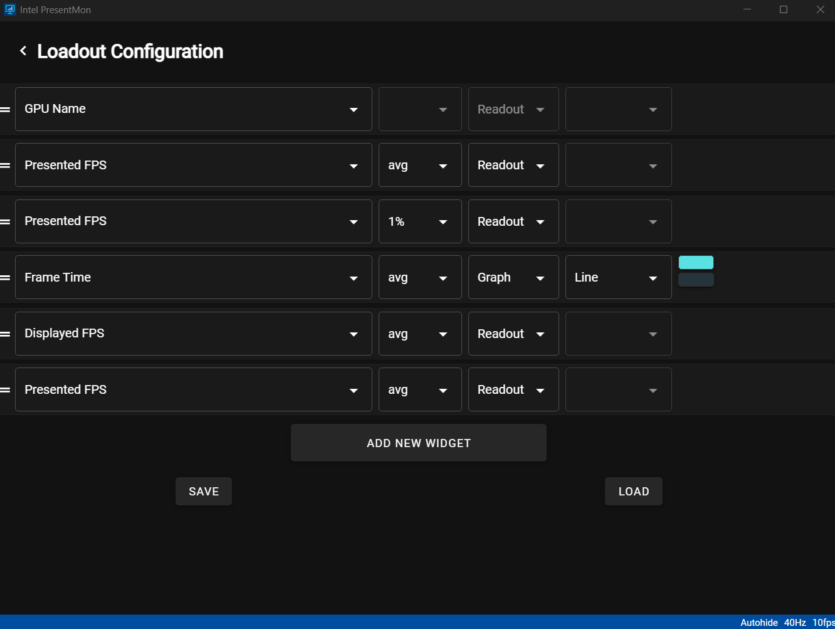
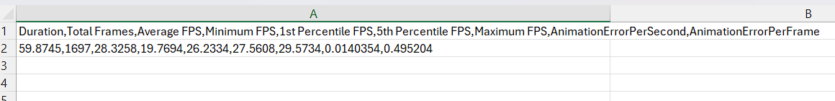
At first glance, the interface is intimidating not only because of its simplicity but also because of its design. Many elements just seem a bit awkward. But it’s not the design that interests us, it’s the settings and monitoring data. And there is nothing wrong with that: all the necessary data is available «out of the box», add convenient hotkeys to start and a timer for the benchmark. The benchmark results are saved in a separate file, so you can quickly find out about the test results in it.
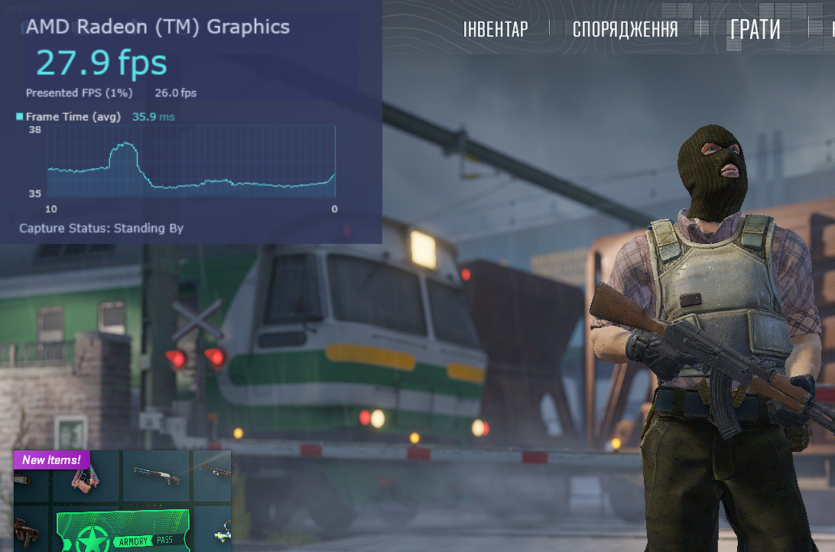
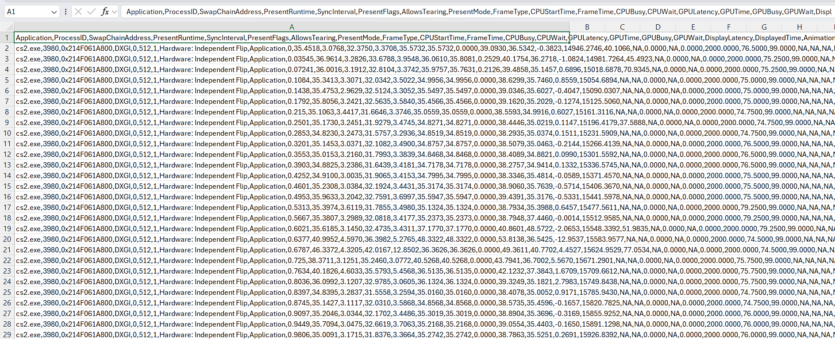
In Counter Strike 2, Intel PresentMon works fully, although MSI Afterburner and RivaTuner do not without additional settings.
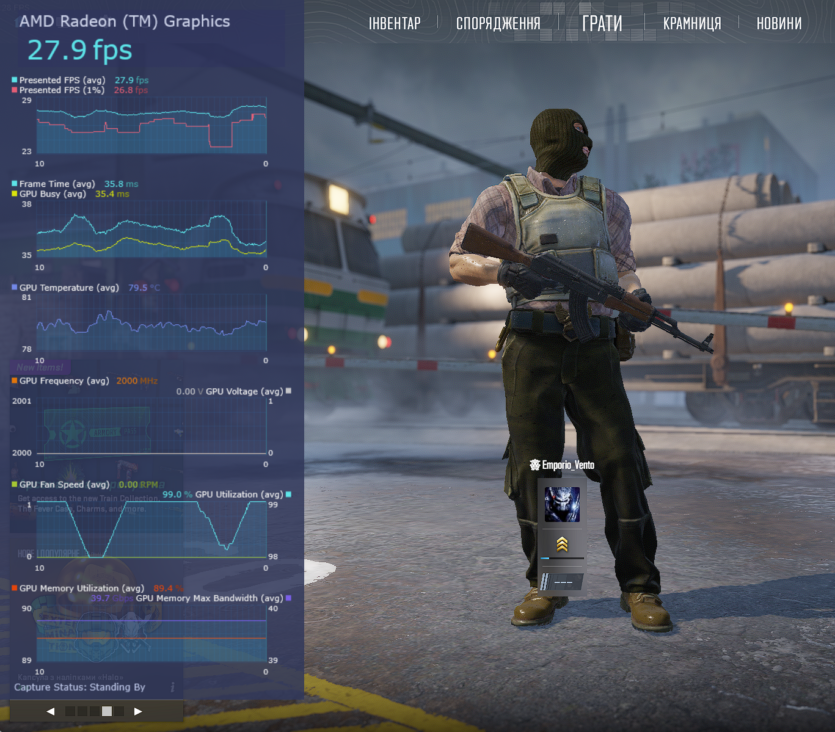
MSI Afterburner + RivaTuner: the good old classic
MSI Afterburner — has been the main system for monitoring performance for many years. Its main feature is that it was created to raise the frequency performance of video cards and processors. Or as they used to say, «overclocking». In the modern world, manufacturers themselves began to engage in this process, which is why the popularity of «overclocking» among ordinary people has fallen. However, PC users have gone in the opposite direction and started to reduce frequencies and voltages for a better life for PC components by reducing performance. This process was called «undervolting».
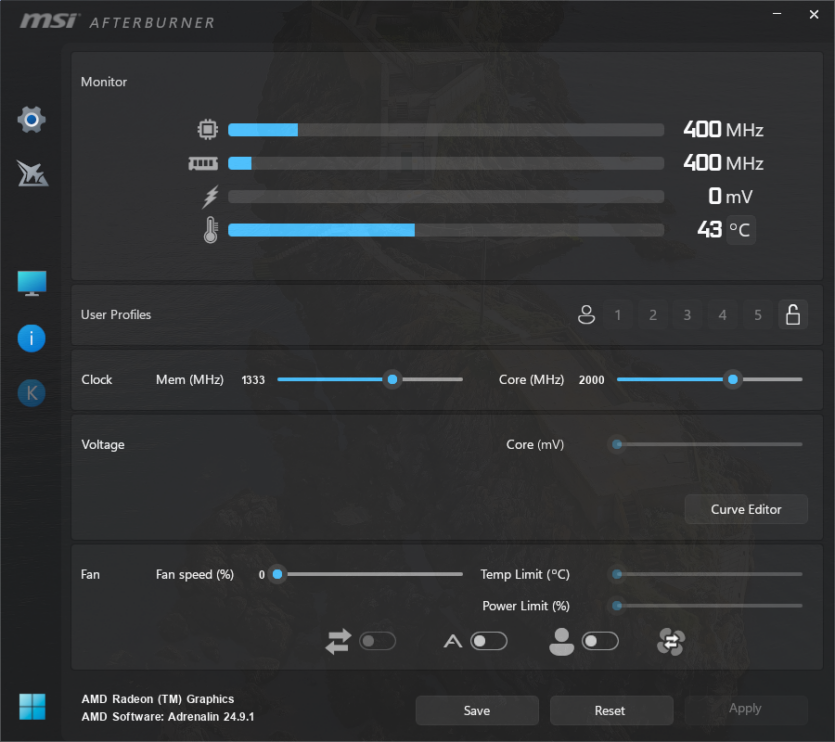
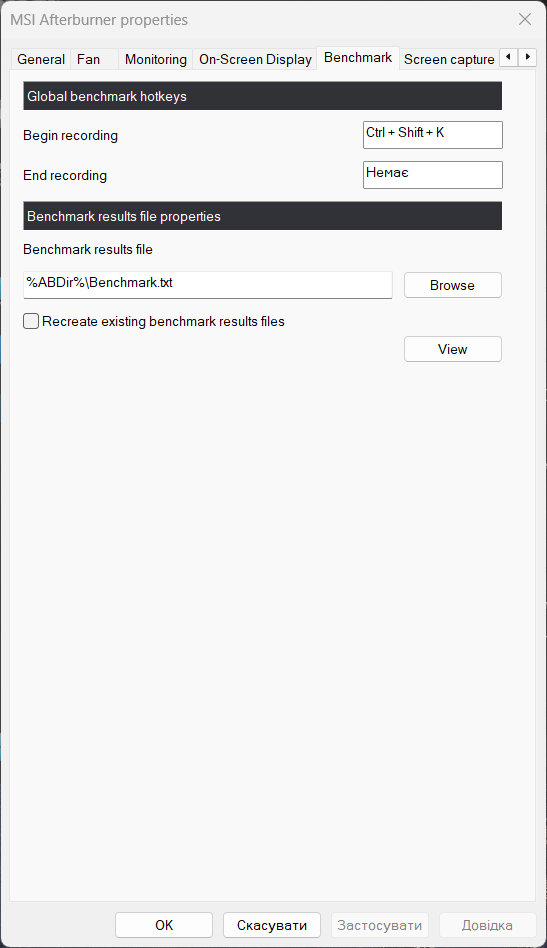
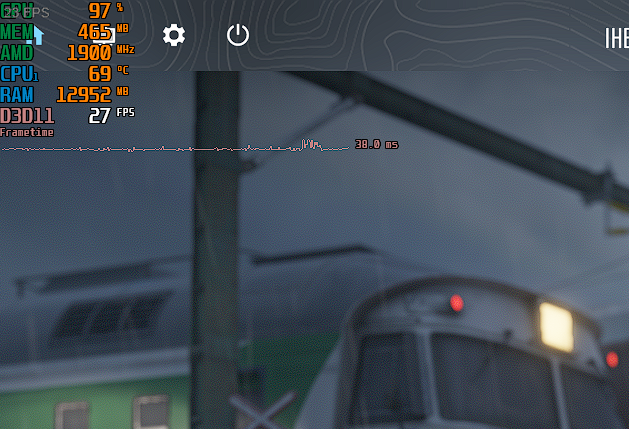
That’s why this application not only monitors many system components, but also has a built-in FPS counter. Still, you should check the performance after changing the parameters of PC components. In general, it is quite easy to understand the application: there are a lot of guides both on Youtube and on the Internet.
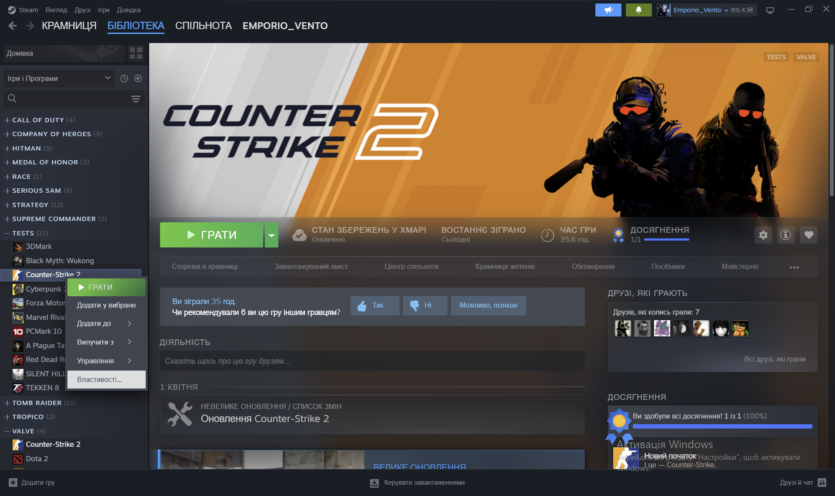
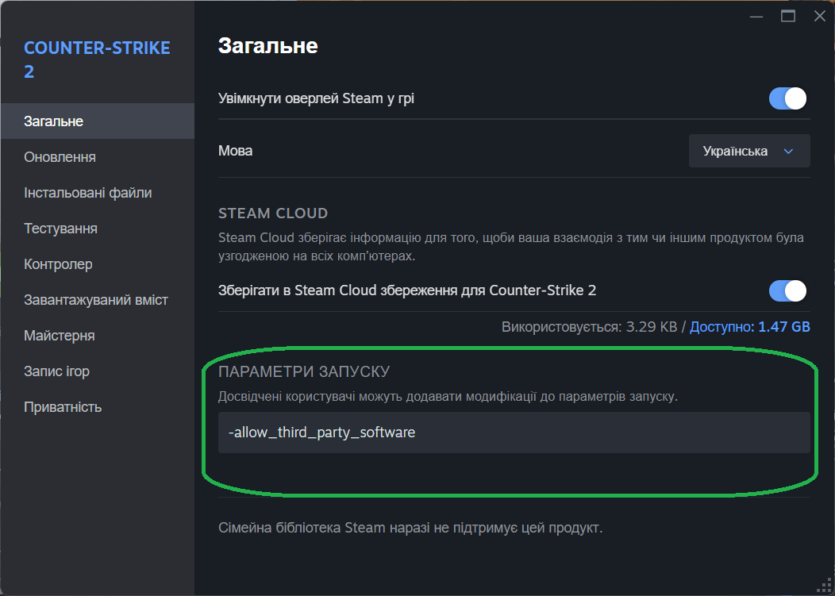
In CS 2, MSI Afterburner does not work by default. To enable it, you need to insert the following parameter in the game settings: -allow_third_party_software.
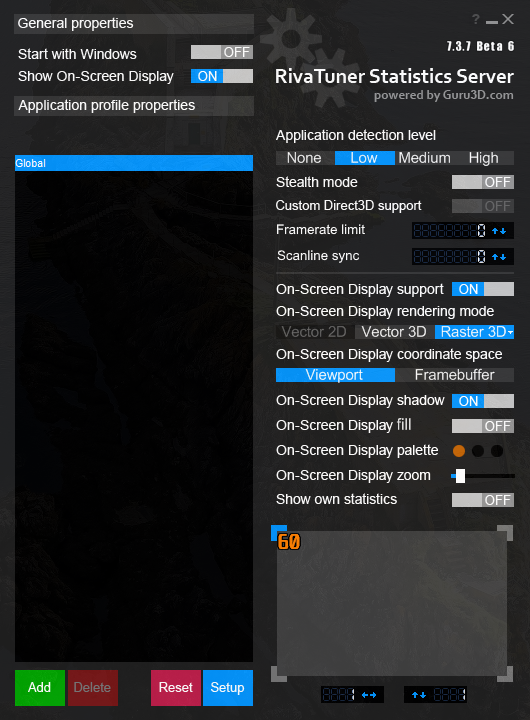
To briefly describe RivaTuner, it is an application for displaying data from MSI Afterburner. It allows you to customize the colors, fonts, and display of data in overlay. The only problem with this program is that it has poor support for high-resolution monitors. Because of this, the interface is too small.
MSI Afterburner will be with us for a long time. Just like HWInfo, AIDA64 and other monitoring programs.
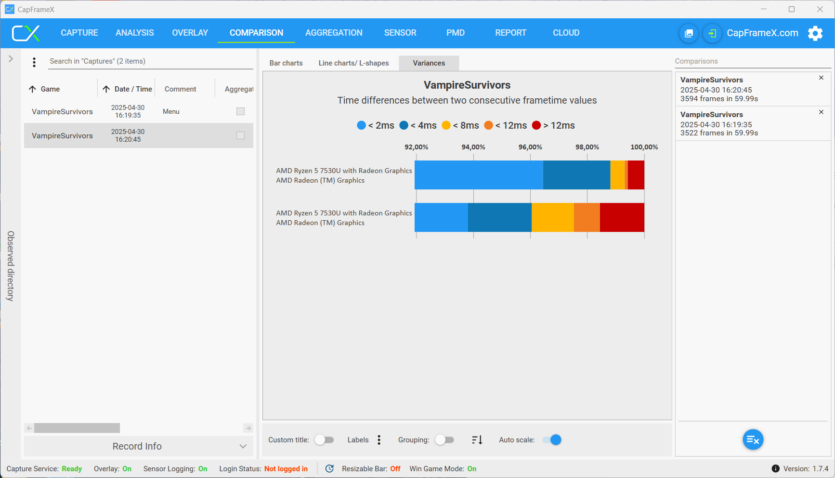
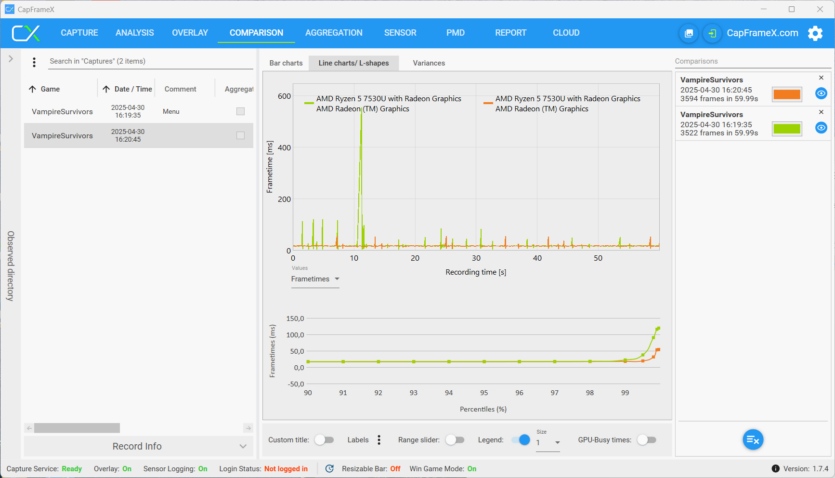
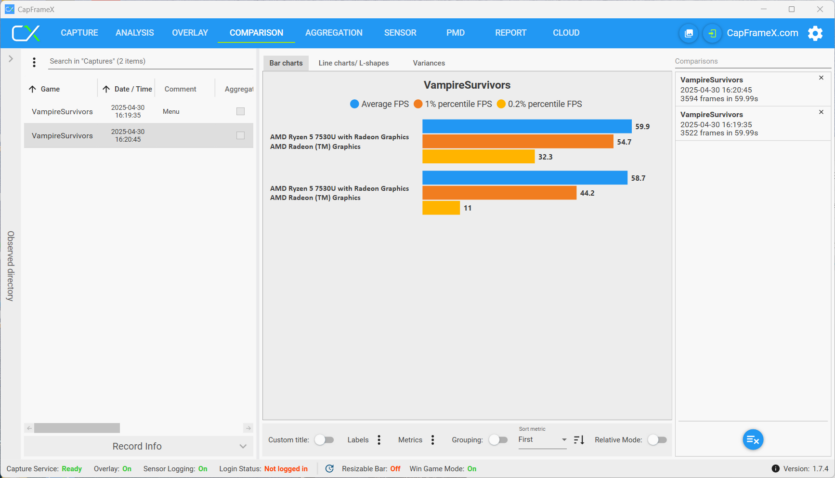
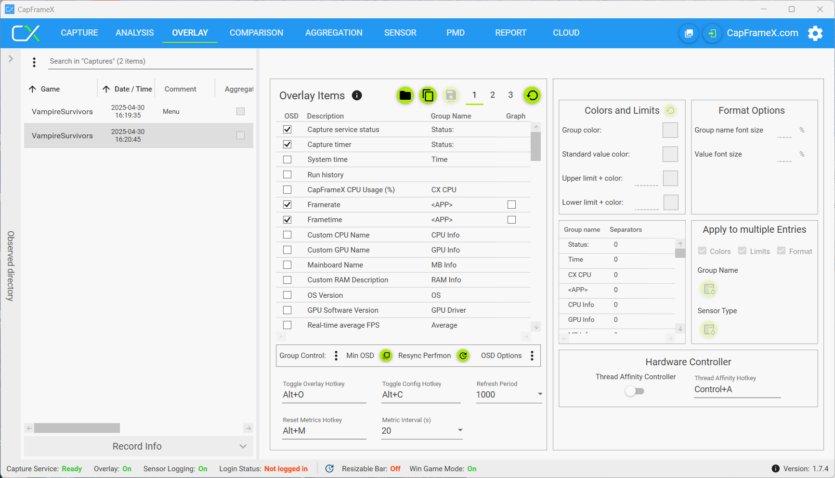
CapFrameX: A new word for professional computer reviewers
If, for some reason, you don’t like any of the above applications, want to have even more statistics and better comparison of the performance of the same or different devices at the same time, then CapFrameX is your choice — the ultimate monitoring and statistics tool.
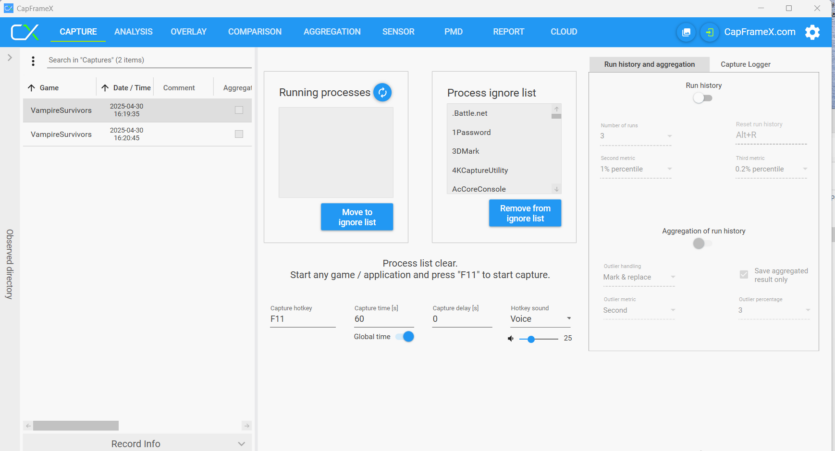
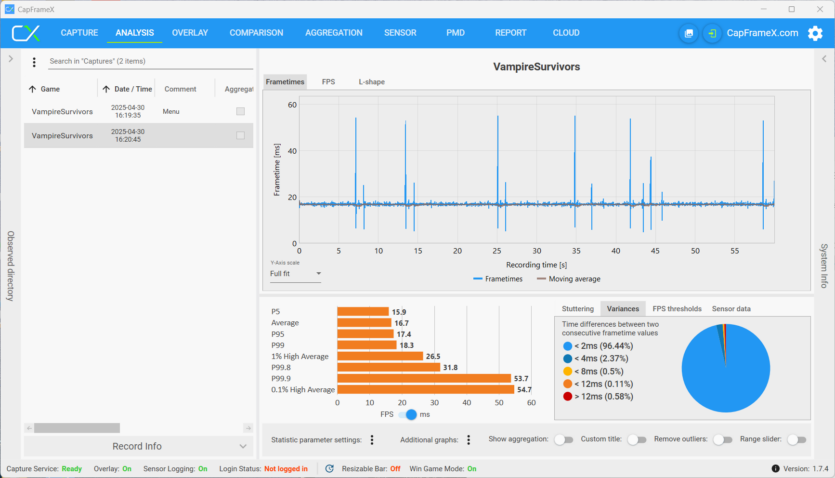
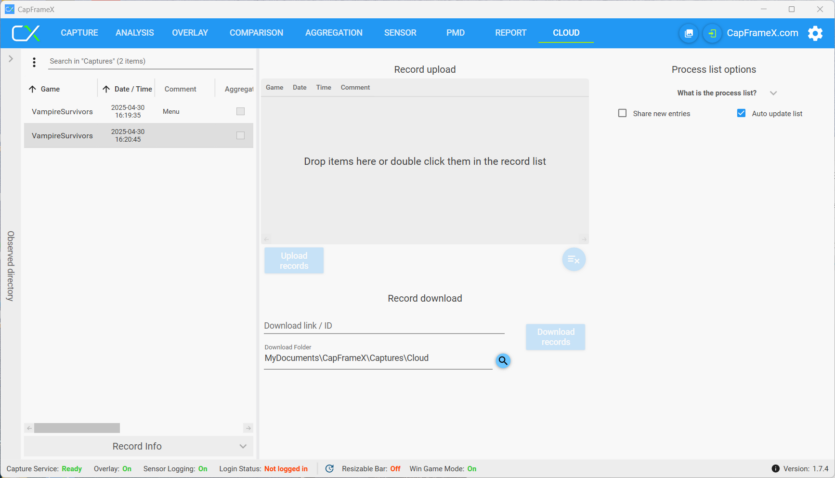
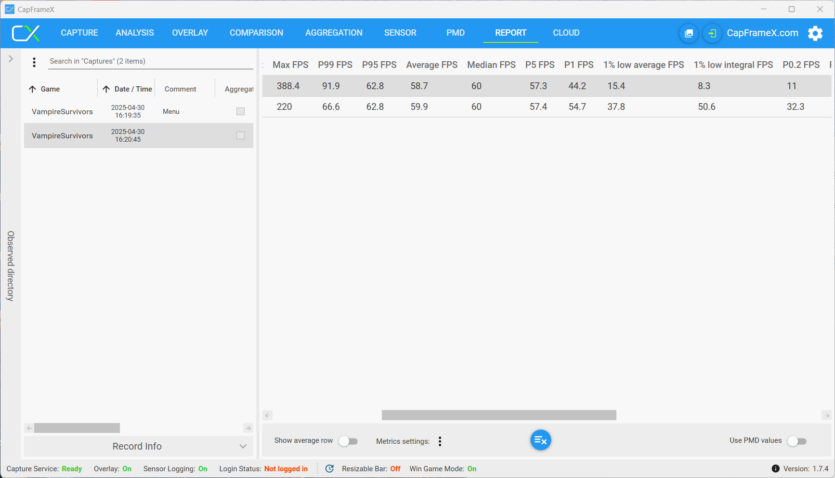
CapFrameX uses Intel’s PresentMon technology to collect statistics and RivaTuner to display overlays in the game. The program interface looks really «monstrous» with a lot of tabs. The large field on the left does not change, it is responsible for the saved results of benchmarks that the user launches using the F11 key. The top tabs open in the right window and allow:
- Capture — Settings for capturing the game;
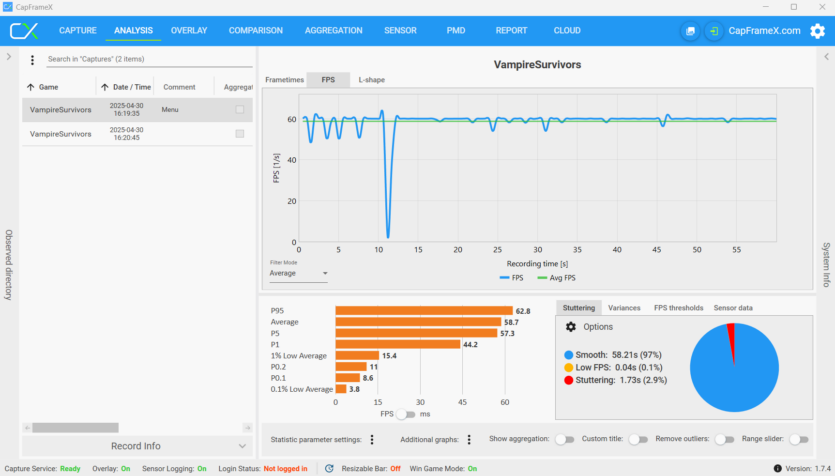
- Analysis — Review the results of FPS and Frametime values and view statistics in the form of graphs;
- Overlay — Settings for viewing overlays in the game;
- Comparison — View and analyze multiple test results;
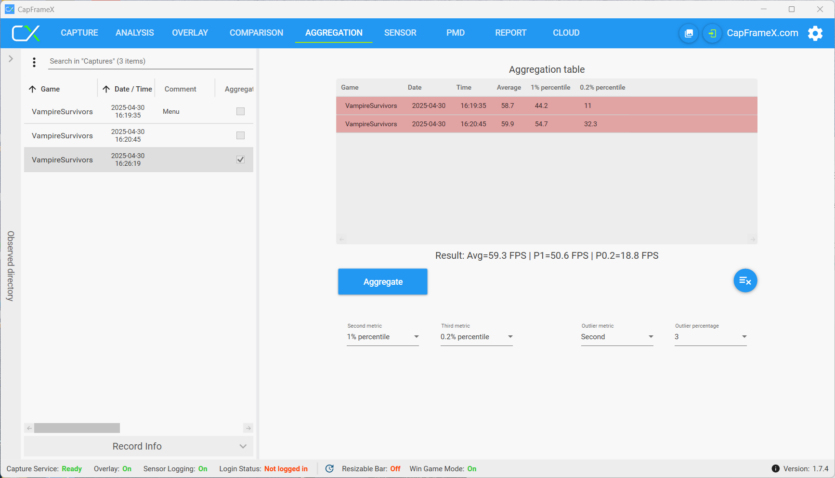
- Aggregation — Combining different «races» according to certain metrics;
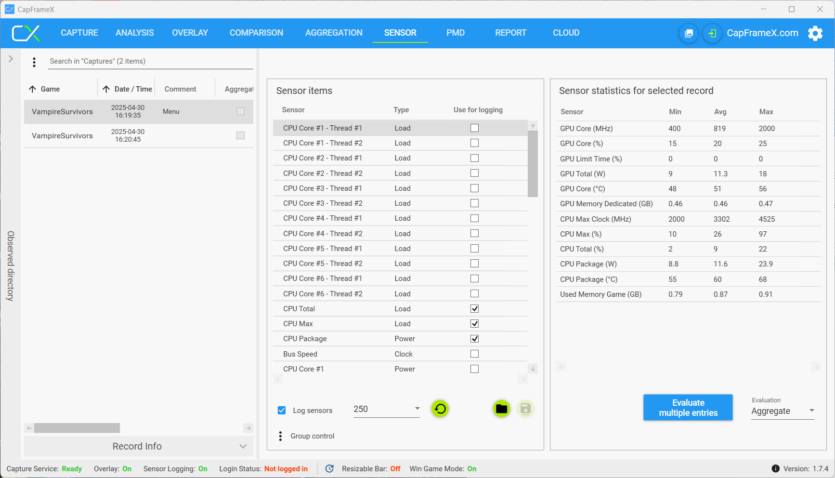
- Sensor — View results from various PC sensors;
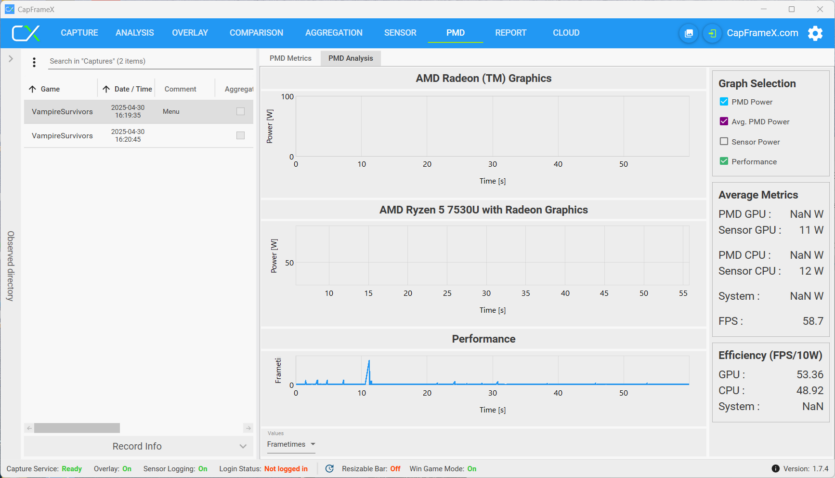
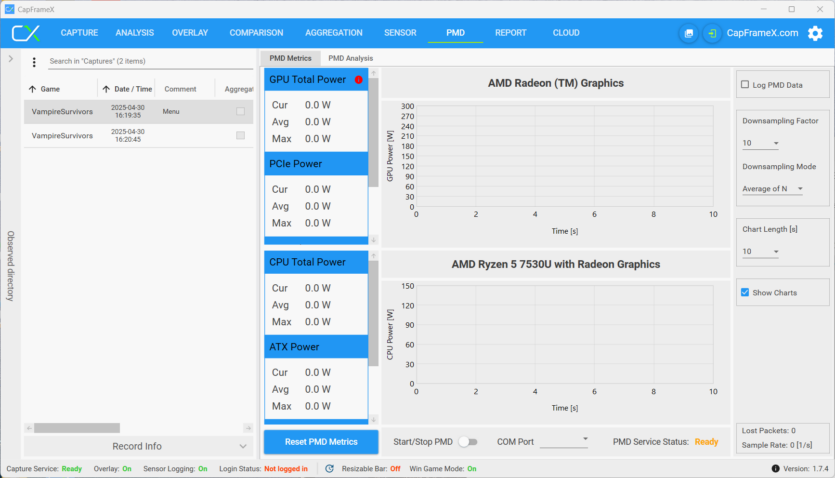
- PMD — Compares the power consumption of the processor, video card, and system as a whole during the test;
- Report — A tabular comparison of both performance and sensor results;
- Cloud — Saving all the results to remote servers;
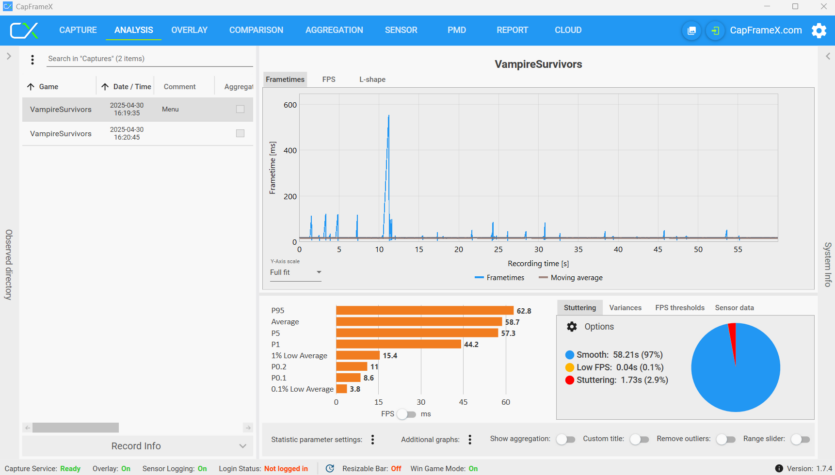
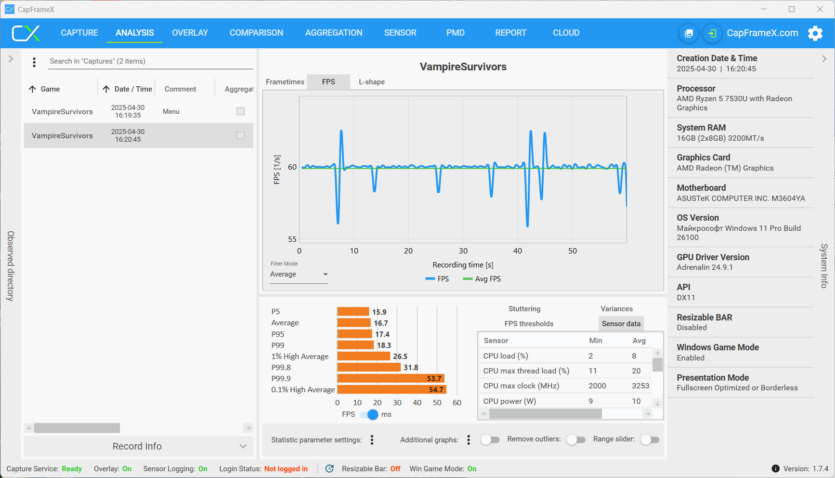
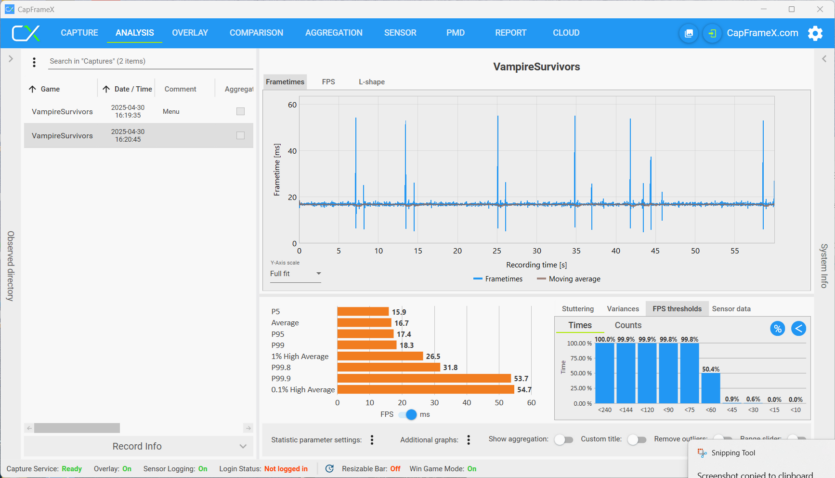
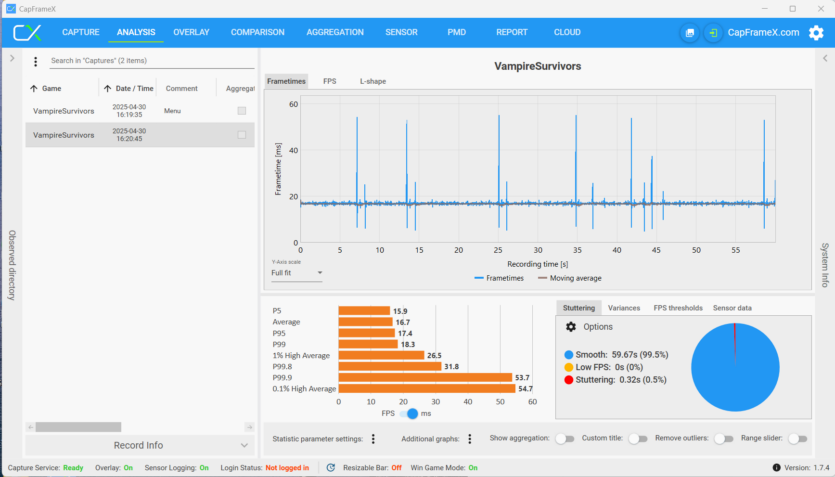
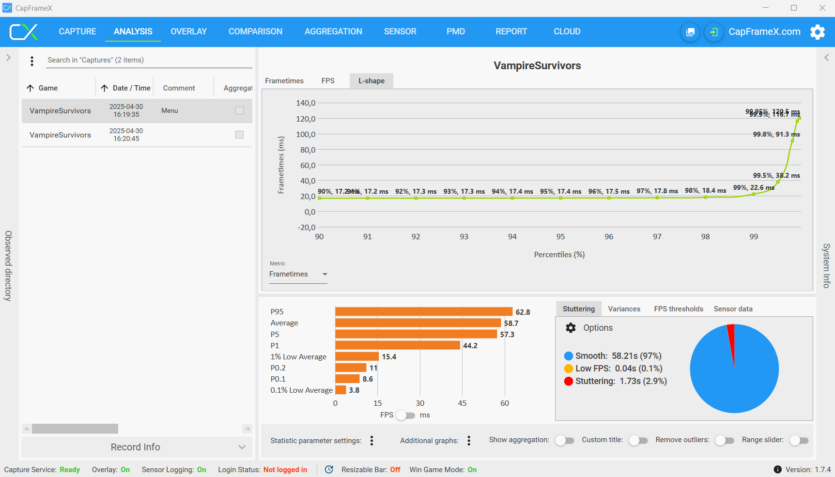
As you can see, CapFrameX has a lot of functionality that ordinary PC users won’t need. Nevertheless, the ability to visually display statistics makes CapFrameX indispensable in professional activities.
A new game with high system requirements is released, in which «the old hardware» cannot show 60 frames per second at maximum graphics settings. During the year, new graphics cards and processors are introduced that are better «than» this game. But after a while, a new game comes along in which «modern hardware» becomes «old hardware». The question remains: Is it possible to get out of this vicious circle? You can answer in the comments.
Spelling error report
The following text will be sent to our editors: